
-
Vijit
- July 23, 2026
- No categories assigned.
- No Comments
The Difference Between Monitoring Availability and Monitoring Experience
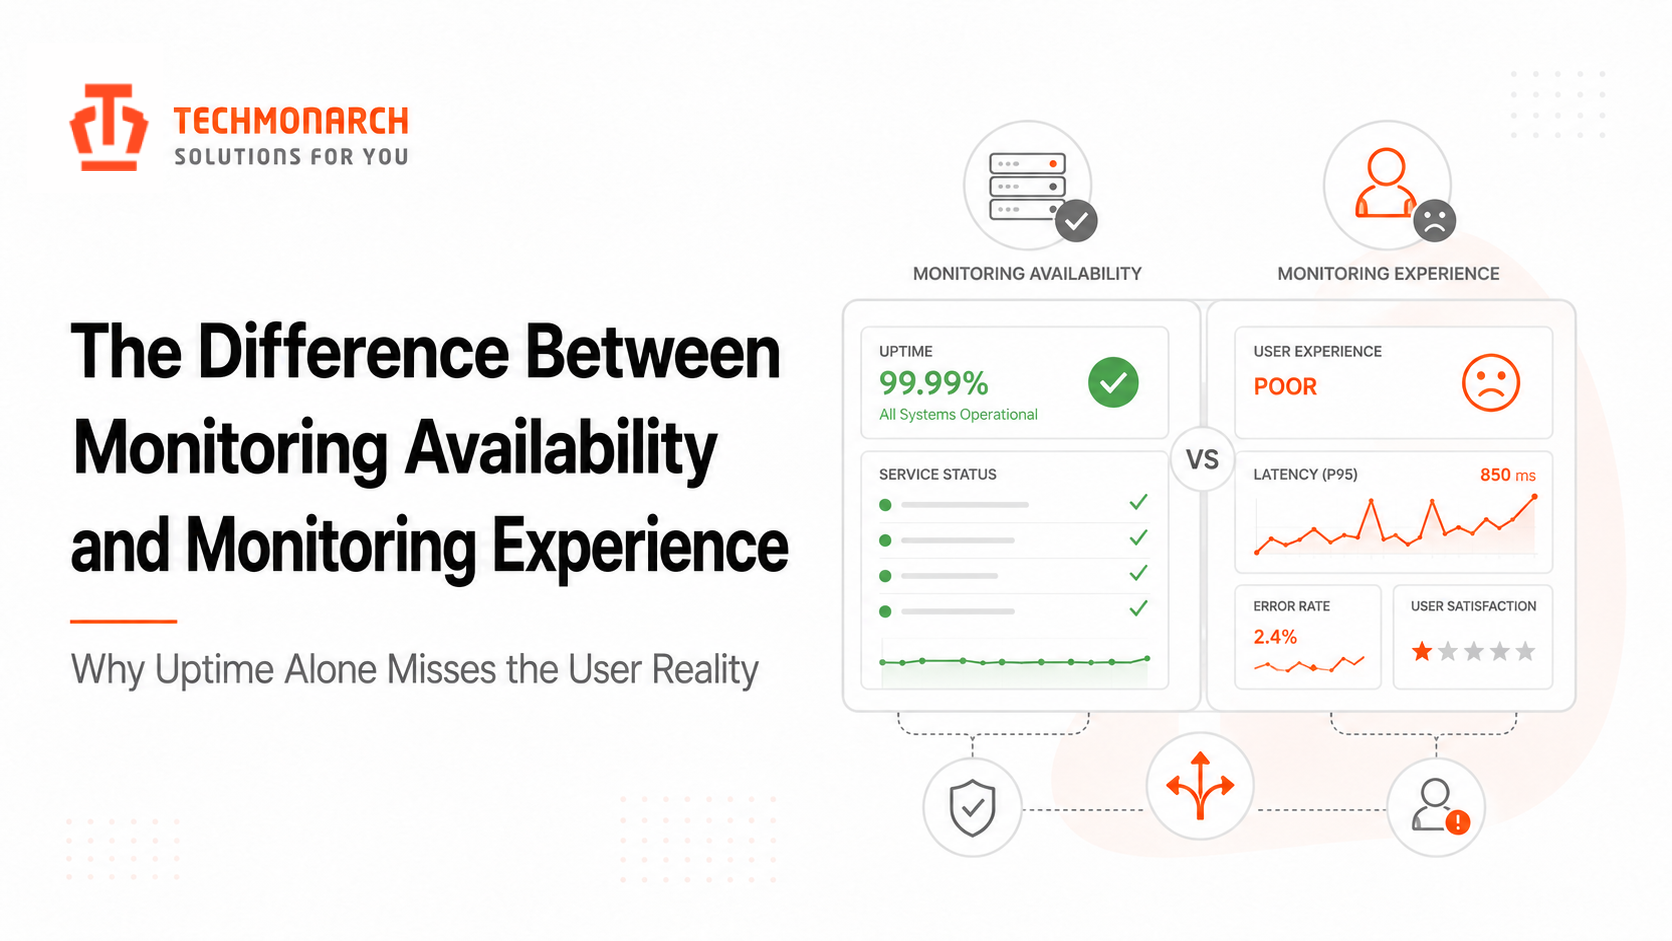
There is a particular kind of client conversation that experienced MSP engineers learn to dread. The client calls to say their systems feel slow, their applications are barely usable, and productivity has been dragging for weeks. You pull up your monitoring dashboards. Everything is green. Uptime is at 99.9 percent. No alerts have fired. Your SLA metrics are clean. From every measurement your monitoring stack tracks, the environment is operating normally.
The client’s lived experience says otherwise. And they are not wrong.
This scenario is not a monitoring failure in the conventional sense. No alerts were missed. No thresholds were incorrectly configured. The monitoring infrastructure did exactly what it was designed to do — and what it was designed to do was measure availability, not experience. Those two things overlap significantly but they are not the same thing, and the gap between them is where a growing category of client dissatisfaction lives in managed services environments.
Understanding that gap — what creates it, why traditional monitoring misses it, and what it takes to actually close it — is increasingly relevant for MSPs that want their service quality metrics to reflect what clients actually experience rather than what infrastructure dashboards report.
What Availability Monitoring Actually Measures
Availability monitoring, as deployed in most MSP environments, measures whether systems are reachable and responding within defined thresholds. A server is up or it is down. A service is responding or it is not. A network path is passing traffic or it is not. These are binary or near-binary states, and they are measured at the infrastructure layer — the hardware, operating systems, network components, and core services that underpin the applications and workflows that end users actually interact with.
This monitoring model was designed for an IT environment where the primary failure mode was infrastructure collapse. If the server was down, users could not work. Bring the server back online and the problem was resolved. In that world, uptime was a reasonable proxy for user experience because the relationship between infrastructure availability and workable user conditions was direct and simple.
That environment largely no longer exists for the client base most MSPs serve. Modern work environments are distributed across SaaS platforms, cloud infrastructure, hybrid connectivity models, and end-user devices that vary significantly in capability and configuration. The failure modes that produce a degraded user experience in this environment are rarely infrastructure collapse. They are latency accumulation across a chain of cloud service dependencies, SaaS provider performance degradation that sits entirely outside the monitored perimeter, application-layer slowdowns that do not produce any infrastructure-level alert, and authentication overhead that adds seconds to every login cycle without ever triggering a threshold.
Availability monitoring catches none of these. The infrastructure shows green because the infrastructure is fine. The experience is poor because the experience is determined by a different set of conditions that availability monitoring was never designed to surface.

The SaaS Dependency Blind Spot
The most pervasive source of availability-versus-experience divergence in modern MSP client environments is third-party SaaS dependency. The typical SMB client environment in 2025 relies on dozens of cloud services for core business functions — email, collaboration, file storage, CRM, accounting, video conferencing, and line-of-business applications that vary by vertical. When any of those services degrades, client users experience it directly. It shows up in slow load times, failed syncs, delayed message delivery, and inability to access documents that are supposed to be available.
None of this is visible to a monitoring stack watching the client’s internal infrastructure. The server is up. The network path to the internet is functioning. DNS is resolving. From the MSP’s monitoring perspective, everything is working correctly. The client’s Microsoft 365 tenant experiencing a backend storage degradation, or their Salesforce instance hitting API rate limits during a peak usage period, or their VoIP provider routing calls through a congested regional node — these conditions produce measurable user experience impact without producing a single alert in a traditional availability monitoring setup.
Research from IsDown on MSP monitoring blind spots quantifies this dynamic clearly: when a major cloud provider experiences an outage, MSP operations teams receive floods of client contacts that all trace back to a single root cause they cannot see in their own monitoring infrastructure. The operational consequence is ghost tickets — support volume generated by conditions entirely outside the MSP’s control and visibility — that consume NOC capacity and create client frustration simultaneously. Centralized SaaS status monitoring that aggregates service health data from third-party providers brings this blind spot into the monitored perimeter. Without it, the gap between what the dashboard reports and what users experience widens every time a client adds a SaaS dependency.
The Problem With Averages
A second structural gap between availability monitoring and experience monitoring is the reliance on average performance metrics rather than percentile-based measurements that reflect the actual distribution of user experience. This distinction matters more than it might initially appear.
Consider a client environment where application response time averages 120 milliseconds across a monitoring window. That average is well within any reasonable performance threshold and will not generate an alert in a system configured to flag response times above, say, 500 milliseconds. What that average conceals is that the 95th percentile response time — the experience of users in the slowest 5 percent of transactions — may be 3 to 4 seconds. Those users are not experiencing a 120-millisecond application. They are experiencing an application that feels sluggish in a way that degrades their productivity, and they will eventually report it.
Percentile-based performance tracking — specifically p95 and p99 measurements — reflects the tail of the experience distribution rather than its center. In environments where application performance is reasonably consistent for most users but systematically poor for a subset, average-based monitoring produces the appearance of healthy performance while a real and reportable experience problem persists undetected. LogicMonitor’s analysis of this dynamic frames it directly: SLA reports can look good, leaving the MSP satisfied, while customers are not satisfied and take their business elsewhere. Uptime does not mean availability, and average response time does not mean acceptable user experience.
What Experience Monitoring Actually Requires
Closing the gap between availability data and experience reality requires a monitoring philosophy shift rather than simply adding more tools to an existing stack. The shift is from infrastructure-out to user-in: instead of asking “are the systems healthy,” the monitoring posture asks “what is the user actually encountering when they try to do their work.”
Synthetic monitoring is one component of this posture. Synthetic monitors simulate user transactions — logging into an application, executing a search, loading a dashboard, submitting a form — on a defined schedule and measure the performance of each step from the user’s perspective. Unlike passive availability checks that measure whether a service is responding, synthetic monitoring measures whether a service is working the way a user needs it to work, and how long each interaction takes. When a synthetic monitor simulates a login to a client’s CRM and discovers that the authentication step is taking eight seconds due to an identity provider latency issue, it surfaces that problem before a single user reports it — and it provides actionable data about which step in the workflow is the source of the degradation.
Real user monitoring — capturing performance telemetry from actual user sessions rather than simulated ones — is the complementary layer. Where synthetic monitoring provides controlled, consistent baseline measurements, real user monitoring captures the full distribution of actual user experience including the environmental variables that synthetic tests cannot replicate: device capability differences, browser version inconsistencies, location-based latency variations, and the interactive complexity of real workflows as opposed to scripted test scenarios. Together, the two approaches produce a monitoring coverage model that reflects what users are actually experiencing rather than what a controlled test or an infrastructure health check would predict.
The Metrics That Bridge the Gap
Translating an experience-oriented monitoring philosophy into operational practice requires defining the metrics that will replace or supplement traditional availability indicators. Several have emerged as practical standards in environments where the monitoring-to-experience gap has been deliberately addressed.
Experience quality scores — composite metrics that aggregate latency, availability, error rate, and where available, user feedback signals — provide a single indicator that captures the multidimensional nature of user experience better than any of their component parts in isolation. Gartner research in this area projects that AI-generated experience quality scores will increasingly replace traditional isolated performance numbers, providing a more comprehensive view of the digital experience that maps more directly to what users report and what client retention data reflects.
Proactive remediation rate — the percentage of experience issues that are identified and addressed before any user reports them — is a second metric that directly reflects monitoring maturity. An MSP whose monitoring detects and resolves a SaaS dependency degradation before any client contact has demonstrated a fundamentally different service capability than one whose first signal of the same problem is a client call. IDC research indicates that proactive digital experience management can reduce IT downtime and service desk contacts by approximately 20 percent. That reduction represents both operational savings and a measurable improvement in the client experience of being supported.
Error budget consumption — borrowed from site reliability engineering practice but directly applicable to managed services SLA management — tracks how much of an allowed degradation window has been consumed within a reporting period. An error budget makes abstract percentages concrete: if a client SLA allows for 99.9 percent availability over 30 days and 60 percent of the allowed downtime budget has been consumed by day 14, that is an urgent operational signal regardless of whether any individual alert has fired. Communicating error budget status to clients in quarterly business reviews transforms a static SLA percentage into a live indicator of service trajectory.
The Conversation Shift This Enables With Clients
The operational value of experience monitoring is measurable in faster detection, reduced ticket volume, and fewer client escalations. The strategic value is in how it changes the MSP’s client relationship from reactive problem resolution to proactive experience ownership. That shift is significant, and it is increasingly a differentiator in competitive MSP positioning.
A client who regularly receives reports showing not just that uptime was 99.9 percent but that their top three applications performed at specific percentile levels, that two SaaS dependency degradations were detected and communicated before they generated any user impact, and that their experience quality score trended positively quarter over quarter — that client has a fundamentally different perception of their MSP’s value than one who receives a green uptime dashboard and a ticket closure report. The first client understands what they are paying for. The second client is one frustrating incident away from questioning it.
MSPs that invest in experience monitoring also gain a more defensible position when client satisfaction dips for reasons outside their control. When a third-party SaaS provider degrades client experience and the MSP can demonstrate that they detected the degradation, communicated it proactively, and tracked its resolution, the conversation is categorically different from the one where the MSP had no visibility into the event and is learning about it from an irritated client. Experience monitoring converts a reactive, defensive conversation into a documented, proactive one.
Where NOC Operations Intersect With the Experience Layer
For MSPs operating 24/7 NOC coverage — whether internally or through a white-label partner — the shift from availability monitoring to experience monitoring has direct operational implications. A NOC function configured to respond to infrastructure alerts will not catch the experience-layer degradations that synthetic monitoring and real user monitoring surface. The alert categories, triage protocols, and escalation thresholds need to be extended to cover experience signals alongside infrastructure signals, and the NOC team needs to be trained to interpret and act on experience data rather than just availability data.
This is an area where the quality of a white-label NOC partnership becomes directly visible. A NOC team that has integrated experience monitoring signals into its alert management workflow — surfacing synthetic monitoring failures, SaaS dependency degradations, and percentile-based performance anomalies alongside traditional uptime and connectivity alerts — provides materially different service coverage than one whose monitoring scope remains at the infrastructure layer. Providers like Techmonarch that build experience monitoring signal handling into their NOC operational framework give MSP partners a coverage capability that extends meaningfully beyond what availability-only monitoring supports.
The Monitoring Philosophy That Reflects the Modern Environment
Availability monitoring is not obsolete. Infrastructure availability is still the baseline requirement — if the server is down, nothing else matters. But in an environment where the client’s work depends on a chain of cloud services, SaaS platforms, hybrid connectivity models, and distributed applications, infrastructure availability is necessary but nowhere near sufficient as a measure of whether clients are receiving the service quality their contracts promise.
The monitoring philosophy that reflects the modern managed services environment starts from the user’s perspective — what they need to work effectively, what conditions degrade that ability, and what signals indicate those conditions before users report them — and builds backward to the monitoring infrastructure required to produce those signals. That approach closes the gap between the dashboard and the experience. It also defines, more precisely than any infrastructure metric can, what an MSP is actually committing to when it signs an SLA. Not uptime. Experience.
Recent Comments
- No comments to show