-
Vijit
- June 18, 2026
- No categories assigned.
- No Comments
Beyond threshold tuning and headcount: a practitioner’s look at why conventional fixes fail and what the high-performing NOC teams are doing instead.
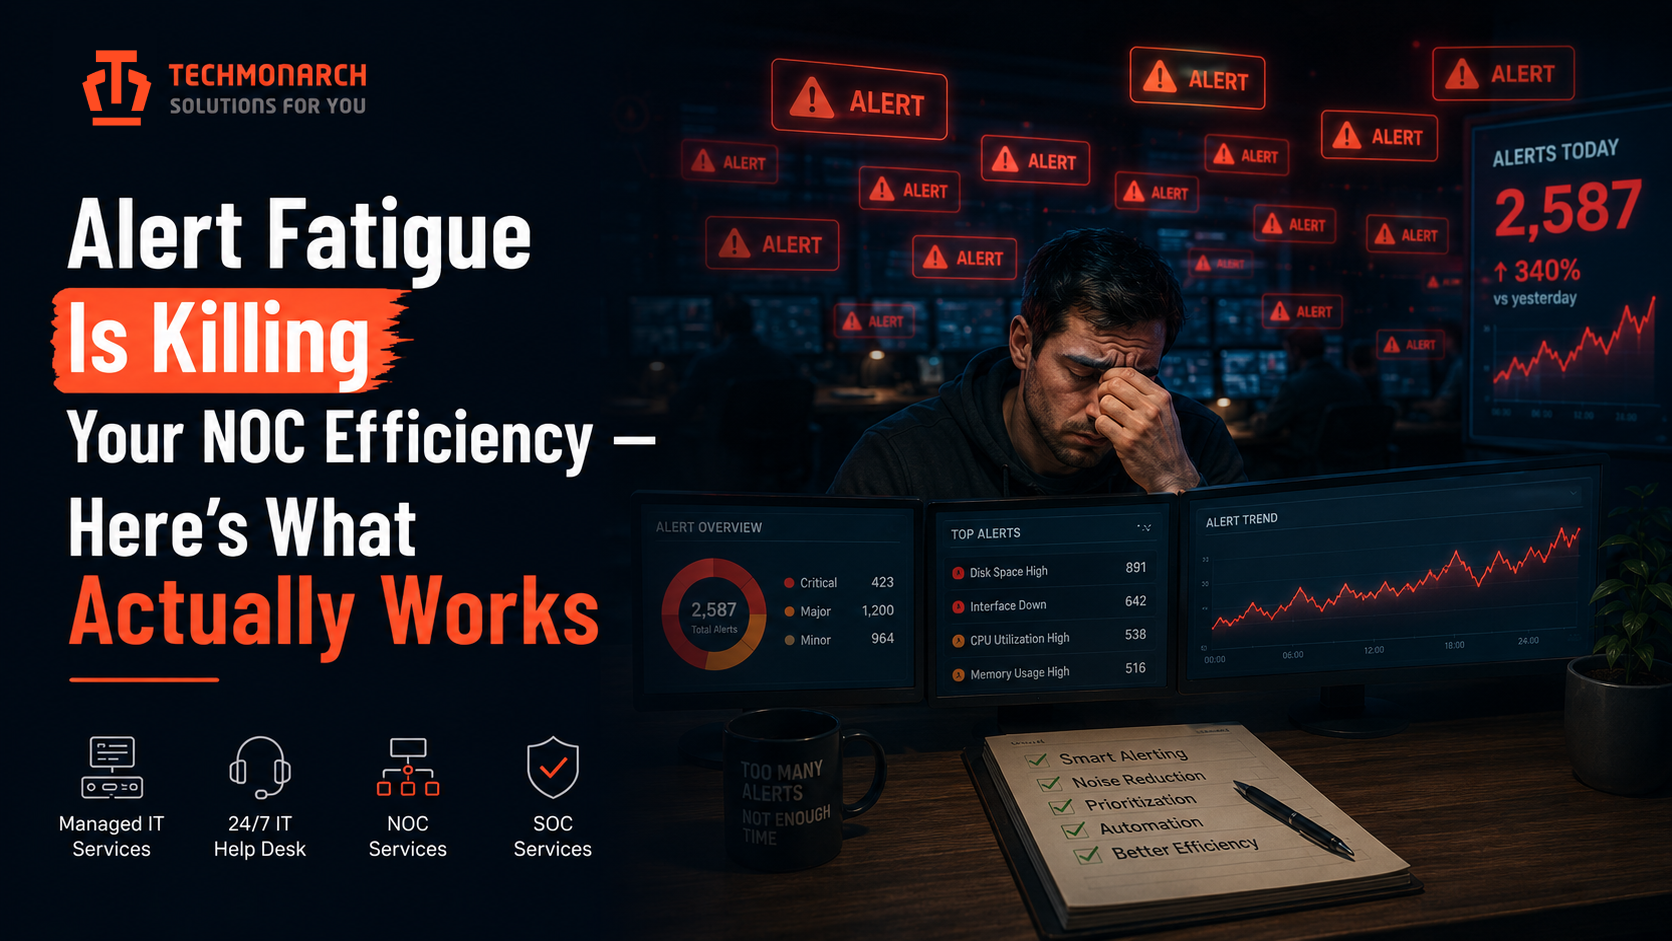
There is a number that most NOC managers quietly dread: the number of alerts their team received today versus the number that actually mattered. If you have run or managed a network operations center for any meaningful stretch of time, you already know that in most environments these two figures are wildly out of proportion. Teams handling hundreds — and in larger MSP environments, thousands — of alerts per shift, where a fraction of a percent represent genuine incidents requiring human judgment. The rest is noise. Expensive, demoralizing, operationally corrosive noise.
Alert fatigue is not a new problem, and this is not written for those who need it explained. What is worth examining carefully — for engineers, NOC managers, and IT service delivery leaders who have already tried the obvious fixes — is why those fixes keep underdelivering, and what a structurally sound approach to the problem actually looks like when you get past the marketing language.
Because the stakes here are not abstract. A 2024 survey found that 62% of security and operations alerts are ignored outright, and that analyst accuracy drops by 40% after extended shifts under high alert load. Those are not productivity statistics. Those are the conditions under which real incidents get missed.
Why the Standard Remedies Keep Falling Short
Most NOC operations that confront alert fatigue cycle through the same set of interventions: raise thresholds, add staff, implement escalation policies, consolidate tools. Each of these produces a short-term reduction in noise, and each of them tends to drift back toward dysfunction within a few months. Understanding why requires being honest about the structural limitations of each approach.
Threshold tuning as a permanent strategy.
Adjusting alert thresholds is a legitimate first response to runaway alert volume, but it is a manual process that expires quickly. Environments change — traffic patterns shift, workloads migrate, new services come online, maintenance windows alter baseline behavior. Static thresholds calibrated for last quarter’s environment become progressively misaligned with this quarter’s reality. A CPU threshold set at 85% may be perfectly reasonable for steady-state operations but completely wrong during a scheduled batch processing window. The result is an endless maintenance cycle: tune, drift, re-tune. Experienced NOC teams end up spending significant engineering time on the monitoring configuration rather than on the infrastructure being monitored.
Tool sprawl and the multi-source problem.
MSP environments, by their nature, are heterogeneous. Multiple clients mean multiple toolsets, monitoring agents, and alerting configurations — each generating its own event stream. A single infrastructure failure in a client environment can cascade into dozens or hundreds of individual alerts across interconnected systems, each firing independently with no correlation to indicate they share a root cause. Without a mechanism to identify that relationship, your NOC team sees not one incident but a storm of unrelated tickets. The cognitive effort required to mentally reconstruct that correlation is significant, and under volume pressure it is where misses happen.
Hiring more people into a broken process.
Adding headcount to absorb alert volume is the most expensive response and often the least effective. New technicians inherit the same noise environment that burned out their predecessors. If the underlying alert architecture is generating 10,000 notifications per day for a team that actually needs to act on 300, adding two engineers does not solve the architectural problem — it just distributes the damage more widely. Burnout in IT operations is already a documented crisis. Recent surveys indicate more than half of IT professionals report feeling overwhelmed by daily workload, and alert fatigue is consistently cited as one of the primary contributors. Retaining experienced NOC engineers in environments like this is notoriously difficult, and the institutional knowledge that leaves with them is rarely fully replaced.
The Architecture of a Well-Tuned Alert Environment
What distinguishes NOC operations that genuinely control alert noise from those that are always catching up to it is not primarily a technology difference — it is an architectural difference. The way alerts are generated, correlated, suppressed, and routed reflects deliberate operational design decisions, not just tool selection.
Dependency-aware suppression over raw deduplication.
Simple alert deduplication — suppressing duplicate notifications for the same condition — is a baseline expectation at this point. What separates mature NOC environments is topology-aware suppression: the ability to recognize that twenty downstream device alerts are caused by a single upstream failure and present them as one incident with full context rather than twenty separate tickets. This requires the monitoring layer to have an accurate, up-to-date map of infrastructure dependencies. When a core switch fails, the appropriate signal is one ticket describing the root cause and the blast radius — not a hundred tickets for each device that lost connectivity. Alert correlation built on dependency mapping consistently represents the highest-leverage architectural improvement available to NOC operations dealing with cascading alert problems.
Dynamic thresholds that reflect actual operational baselines.
The shift from static to dynamic thresholds is one of the more consequential improvements a NOC team can make to its signal-to-noise ratio. Dynamic thresholds, whether implemented through AIOps platforms or through more manual baselining processes, account for patterns that static configurations ignore: the time of day, the day of week, scheduled maintenance windows, and historical behavior for a specific asset in a specific environment. A server that legitimately spikes to 95% CPU every night at 1 AM during a database maintenance job should not be generating a P2 incident alert at 1 AM. It should only generate one if that spike occurs at an unexpected time or lasts beyond its normal window. This distinction — between expected behavior and anomalous behavior — is what separates signal from noise, and static thresholds cannot make it reliably.
Severity classification that maps to actual business impact.
One of the most common sources of NOC inefficiency is miscalibrated severity tiers. When everything is P2, nothing is P2. Alert severity should map to actual business impact — not to the technical parameters of the underlying event. A disk filling on a non-production server and a disk filling on a primary transaction processing server are technically similar events; they are operationally not even close to equivalent. Severity classification that is tied to client context, asset criticality, and business impact creates a queue that engineers can actually work with: a small number of genuinely urgent items at the top, and a progressively lower-urgency backlog below. Without this calibration, engineers spend the same cognitive energy on low-impact events as on high-impact ones — and that is the definition of wasted operational capacity.
The Role of AIOps: What It Actually Solves and What It Does Not
AIOps has been positioned as the solution to alert fatigue for several years now, and the vendor noise around it has made it harder — not easier — to assess where it genuinely delivers and where it falls short. Having been involved in evaluating or deploying these platforms in production environments, the honest picture is more nuanced than most sales conversations suggest.
Where machine learning-based alert correlation works well: it is genuinely effective at ingesting event streams from multiple monitoring sources and grouping related alerts into unified incidents. A network switch degradation that historically triggers 500 individual service alerts can, with a mature AIOps layer, be reduced to a single enriched incident with root cause context already attached. Case data from production deployments has shown alert noise reductions of 70% to 85% in well-configured environments. An MSP implementation documented by LogicMonitor achieved 78% alert noise reduction, 70% fewer duplicate tickets, and an 85% drop in overall incident volume after deploying AI-driven correlation. These are not theoretical numbers — they represent the genuine ceiling of what the technology can do when conditions are right.
The important caveats: AIOps platforms depend on data quality. The correlation engine is only as good as the telemetry it ingests. Fragmented monitoring tools with inconsistent metadata tagging, poor coverage of certain infrastructure domains, or inadequate historical data will produce misleading correlations and suppress alerts incorrectly. The garbage-in-garbage-out problem does not disappear with AI — it just becomes less visible until something goes wrong. Additionally, auto-remediation capabilities should be implemented with deliberate caution. Automation that handles well-understood failure patterns — restarting a failed service, cycling a connection, clearing a disk threshold — reduces overnight human workload meaningfully. Automation that attempts to remediate novel or ambiguous incidents creates risk. The safest and most operationally mature approach is a human-in-the-loop model where automation handles the known, routine case load and human judgment is reserved for exceptions.
Runbooks That Are Actually Maintained
Runbooks are one of those operational artifacts that everyone agrees are essential and most organizations keep in a state of perpetual underdevelopment. In the context of alert fatigue, well-maintained runbooks serve two functions that are easy to underestimate.
First, they enable automation to act confidently. An AIOps or RMM platform that can execute a runbook automatically when a known pattern fires is removing a class of alerts from the human queue entirely — but only if the runbook is current and accurate. Runbooks that are stale, incomplete, or written for a previous version of the infrastructure create automation risk. In MSP environments where client systems are heterogeneous, per-client runbooks are not a luxury but an operational necessity. One client may use Active Directory, another LDAP; one may run Oracle, another PostgreSQL. The automation layer needs to know which is which.
Second, runbooks enable less-experienced technicians to handle a wider range of incidents without escalating to senior engineers. In a properly structured NOC, Tier 1 should be able to close a meaningful percentage of incidents using documented, step-by-step procedures. Every incident that a Tier 1 engineer resolves using a runbook is an escalation that a senior engineer did not have to handle. At scale, across multiple client environments, this has a significant impact on the cognitive load at the top of the support stack.
Runbook maintenance needs to be treated as an operational discipline, not a documentation project. Assign ownership. Schedule reviews. Track which runbooks are actually being used and which are not. Runbooks that engineers never reach for in practice are either covering scenarios that do not occur, or they are so outdated that engineers no longer trust them. Both are problems worth diagnosing.
The MSP-Specific Complexity Layer
Everything discussed above applies to NOC operations generally. In MSP environments — particularly those providing white-label NOC services to other MSPs or managing multi-client infrastructure — there is an additional complexity layer that deserves its own attention.
Alert thresholds are not universal. What constitutes a critical alert for one client may be normal behavior for another. An 80% CPU threshold that triggers a P1 for a client with a two-server footprint may be routine operating condition for a client running load-balanced infrastructure across sixteen nodes. Applying uniform monitoring configurations across a multi-client MSP environment is operationally incorrect — it produces false positives for some clients, false negatives for others, and creates exactly the kind of noise that causes engineers to stop trusting the alerting system.
Per-client monitoring configurations — alert thresholds, escalation rules, severity classifications, maintenance window suppression — require systematic management. This is significant operational overhead, and it is one of the primary reasons that NOC operations under white-label partnerships or outsourced arrangements often deliver more consistent alert management than in-house NOC teams at smaller MSPs. Dedicated NOC operations with multi-client experience have developed the templating, metadata management, and per-client configuration infrastructure to handle this correctly. A 10-engineer MSP managing 40 clients often has not.
For MSPs navigating this complexity, white-label NOC partnerships can bridge the gap between what a growing client portfolio demands and what an internal team can realistically sustain. Providers like Techmonarch (techmonarch.com), built specifically to serve the MSP channel, operate NOC functions under the partner’s brand — handling alert triage, first-level remediation, and escalation management across multi-client environments with the per-client configuration depth that makes the difference between controlled monitoring and managed chaos.
Measuring Whether Any of This Is Actually Working
One of the quiet failures of many alert fatigue reduction initiatives is the absence of meaningful measurement. Teams implement correlation tools, tune thresholds, or deploy AIOps platforms, then measure success by how the engineers feel — which is a real signal, but not a sufficient one. Proper measurement of alert environment health requires tracking specific operational metrics over time.
The signal-to-noise ratio — the proportion of actionable alerts to total alerts — is the foundational metric. Industry benchmarks suggest that a healthy alert environment produces a signal-to-noise ratio where at least 30% of alerts require human action. Most struggling NOC environments are operating well below that. Tracking this number week over week after any configuration change tells you whether your intervention is working, or whether the improvement was temporary.
Mean Time to Detect (MTTD) and Mean Time to Respond (MTTR) are the downstream metrics that matter most to SLA compliance and client experience. A lower alert volume that simultaneously increases MTTR is not an improvement — it means you have suppressed alerts you should not have suppressed. MTTD and MTTR moving together in the right direction, with a lower signal-to-noise ratio, is the combination that indicates genuine improvement rather than a tradeoff that will surface as a missed incident next quarter.
Escalation rate by tier is a metric that many NOC operations track for SLA purposes but few examine for process insight. If Tier 1 is escalating 80% of its tickets to Tier 2, you have a tier design problem — either Tier 1 lacks the tools and runbooks to handle the incident types landing in their queue, or the incidents are being routed to the wrong tier in the first place. Escalation rate should be reviewed quarterly as part of the same process review cycle as alert threshold audits.
What Actually Works: The Short Version
The NOC teams that have genuinely solved alert fatigue — not managed it, not pushed it to an acceptable level of dysfunction, but actually solved it — share a few operational characteristics that hold regardless of toolset or client mix.
They treat alert architecture as infrastructure. The monitoring configuration is as carefully engineered and maintained as the systems it monitors. Thresholds are reviewed on a schedule, not in response to a crisis. Dependency maps are kept current. Per-client configurations are version-controlled and documented.
They instrument the alert environment itself. They measure signal-to-noise ratio, track suppression effectiveness, and run quarterly audits of alert sources to identify which monitoring configurations are generating the most noise. Problems are identified from data, not from engineer complaints — though engineer complaints are taken as a valid diagnostic signal that something needs measuring.
They use automation to absorb routine load, not to replace human judgment. Auto-remediation for known failure patterns, maintenance window suppression, and automated triage and routing are all legitimate uses of automation that reduce human workload without introducing meaningful risk. Automating responses to novel or ambiguous incidents is where implementations go wrong.
And they recognize that alert fatigue is a symptom of architectural decisions, not a people problem. Adding engineers, implementing on-call rotations, or pushing for better attention from an already-overwhelmed team does not address the root cause. The root cause is an alert environment that was not designed to protect human attention — and fixing it requires the same level of deliberate engineering that you would bring to any critical infrastructure problem.
Because that is what it is. Your NOC team’s attention is a finite, valuable operational resource. The monitoring architecture either protects it or depletes it. Everything else follows from that design choice.
Recent Comments
- No comments to show